
School Account Admin-Dashboard
Overview
As a School Account Admin, you have access to the Admin Dashboard, which provides an overview of activity and usage across your school’s ISS Supply Marketplace account. The dashboard is designed to give Account Admins a quick view of important transaction and purchasing information.
To access the Admin Dashboard, select the “Admin” link at the top of the Marketplace page. The Admin Dashboard will then be displayed, providing access to the available dashboard widgets and account information.
The Admin Dashboard contains several widgets that display useful data about transactions and usage within your Marketplace. These widgets provide a convenient way to monitor purchasing activity and gain insight into how your school is using the Marketplace.
Admin Dashboard
The Admin Dashboard contains several widgets intended to show useful data about transactions and usage within your marketplace.
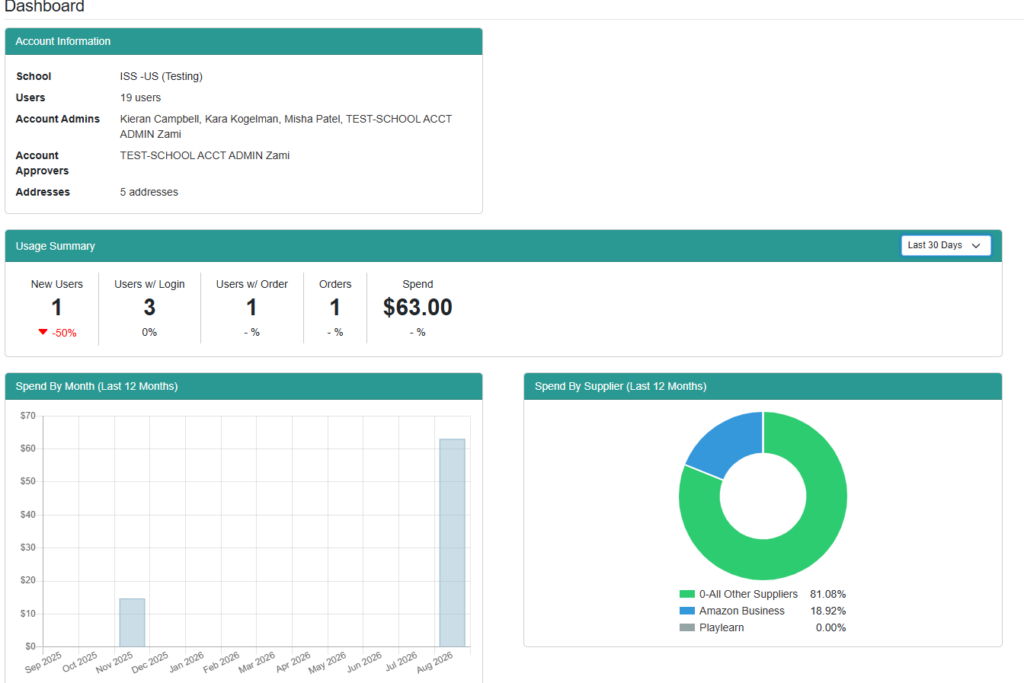
Usage Summary

- Use the drop-down menu in the top right corner to choose a time frame of the Last 30 days, Last 7 days, or Last 24 hours. The time frame selected in this drop-down menu will only affect the data shown in the Usage Summary section.
- The Usage Summary section will show Orders and Spend (as pictured above).
- The percent increase/decrease from the previous timeframe to the current timeframe will be shown below each number. For example, if the selected timeframe is Last 7 days, the data from the current 7-day period will be compared to the previous 7-day period.
Data shown above:
- New Users: The number of new users created within the timeframe.
- Users’ w/ Login: The number of unique users who logged in during this timeframe.
- Users w/ Order: The number of unique users who placed orders during this timeframe.
- Orders: The number of orders created within the timeframe that have been sent
- Spend: The total dollar amount from all orders created within the timeframe that have been sent
Spend by Month
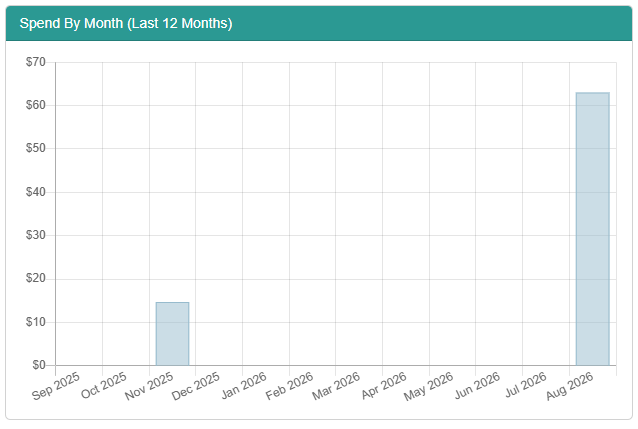
- The Spend By Month section shows the past 12 months of data for amount spent in the marketplace, including the current month on the far right. The amount is based on the total amount spent in orders sent in the marketplace or PunchOut carts submitted.
- Hover over any month’s data bar to see the exact amount for that month.
Spend By Supplier
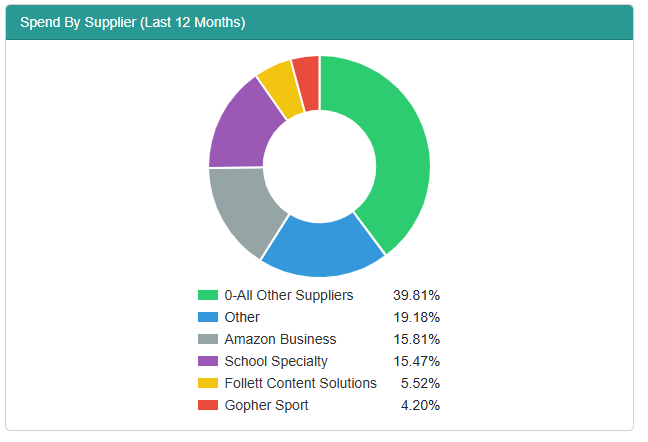
- The Spend By Supplier section shows the 5 suppliers with the highest spend in the marketplace. The spend for all remaining suppliers is included in the “Other” section. The percentages show the percent spend for that supplier compared to the total spend for the marketplace.
- Hover your mouse over any section of the pie chart to see the dollar amount for that supplier.